


Heat transfer through a wall and insulation of a wall
To ensure proper insulation, you must carefully select the appropriate building components. The ability of a building component to insulate depends on its thermal resistance. But how can we determine the thermal resistance of a building component?
One solution is the TRSYS20, a high-accuracy measuring system designed to determine the on-site thermal resistance, thermal conductance, and thermal transmittance of building envelope components.
This article explains how the TRSYS20 system measures heat transfer through a wall. First, we present the thermal quantities required to measure thermal resistance and transmittance. Second, we discuss the components of the TRSYS20 system. Third, we elaborate on the functioning of the system. We also discuss the installation process and how to take a measurement. Finally, we highlight the advantages of using the TRSYS20 system over other measuring systems.
Thermal resistance and thermal transmittance
Heat flux is the transfer of energy through a surface area, expressed in watts per square meter (W/m2). There are three heat transfer types - conduction, convection, and radiation. Thermal resistance, also known as the R-value, is a property of an object that determines how much it resists heat flux. The higher the thermal resistance, the slower the heat transfer, and the lower the thermal resistance, the faster the heat transfer.
Quantitatively, the thermal resistance depends on the heat flux and the temperature difference between two reference points. The formula that describes how to calculate thermal resistance is given by:
![]()
Where
-
 is the differential temperature (K)
  is the heat flux (W/m2)
Alternatively, we can talk about thermal conductance, which is the reciprocal of the R-value and expressed as the Λ-value.
The U-value (or thermal transmittance) is another measure of heat transfer through matter. The U-value is similar to the R-value, except that it includes the thermal resistance of the surrounding air (the “boundary layer thermal resistance”) in the measurement. The U-value is calculated similarly to the R-value by dividing the temperature difference by the heat flux.
The TRSYS20 measuring system
Figure 2 shows the TRSYS20 measuring system that determines the thermal resistance (R-value), thermal conductance (Λ-value), and thermal transmittance (U-value) of building envelope components. This high-accuracy measuring system includes two HFP01 heat flux sensors, two matched thermocouple pairs, a measurement and control unit (MCU), a power supply unit (PSU), and a carrying case.
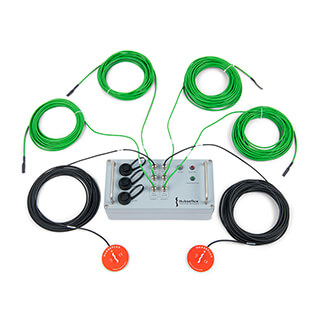
two HFP01 heat flux sensors and two matched
thermocouple pairs connected to the measurement and
control unit (MCU).
An HPF01 heat flux sensor and two thermocouples with 10-meter cables are used on one side of the measurement location. On the other side, the same sensors are used, but with 20-meter cables.
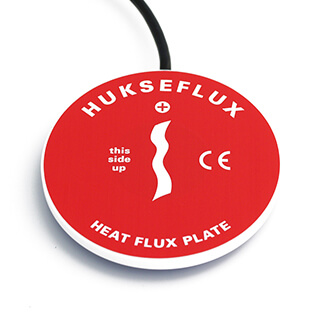
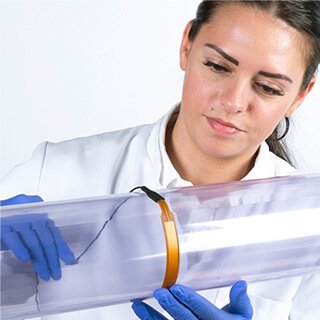
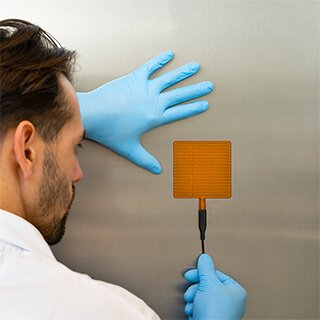
Figure 3 shows the HFP01, a highly sensitive heat flux sensor that measures heat flux levels through walls and building envelopes. It can accurately measure very low heat flux levels with a sensitivity of 60 × 10-6 V(W/m2). It is designed to be placed inside the building.
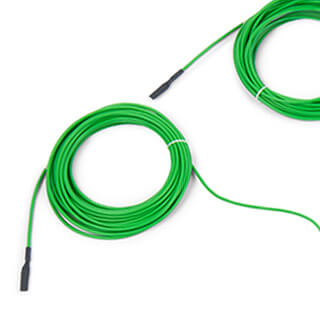
The thermocouple pairs, as shown in Figure 4, are of type K and are carefully paired to ensure precise temperature difference measurement. The thermocouple pairs and electronics are tested for 0.1°C accuracy over the temperature range of -10 °C to 50°C, as required by ISO standards.
The six sensors are attached to the MCU, or measurement and control unit, as shown in Figure 5. This is the heart of the system. It houses the data logger and provides both USB and ethernet connections. The MCU measures the output voltage of the heat flux sensors and the thermocouples and displays these values in the user interface.
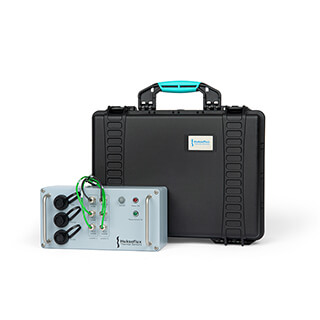
In addition to the sensors and the MCU, the TRSYS20 comes with a power supply unit, a USB-A to USB-B cable, two product certificates for HFP01, and one product certificate data logger. All these items are delivered in a robust carrying case.
The TRSYS20: how to work with it
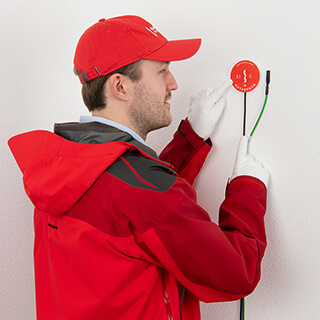
Figure 6 shows an example of how to measure thermal resistance with the TRSYS20. An HFP01 sensor is placed on the inside of a wall, while thermocouples are placed on both sides of the wall. The inside temperature is 19 °C, while the outside temperature is -5 °C. This temperature difference causes a heat flow from hot to cold. The HPF01 measures this heat flow, while the thermocouples measure the temperature difference. If these quantities are tracked over at least 72 hours, the thermal resistance can be calculated with the help of the data logger.
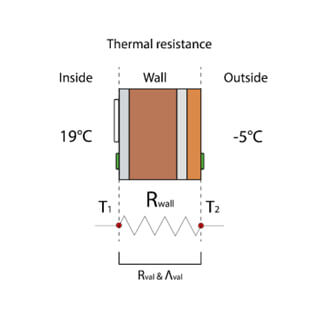
measurement of a wall. The white object on the inside of
the wall represents an HFP01, and the green objects on
both sides represent the thermocouple pair.
Figure 7 illustrates an experimental setup for measuring thermal transmittance. Compared to a thermal resistance measurement, the thermocouples are now placed in the ambient air instead of being in direct contact with the wall. The air boundary layer thermal resistance is now included in the measurement.
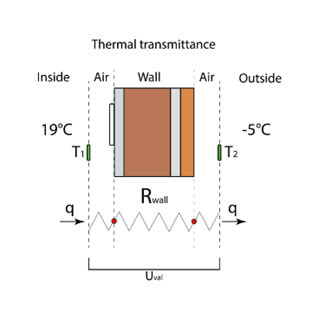
transmittance measurement of a wall. The thermocouples
are now placed in the ambient air instead of on the wall.
Installation of the system
Now that we understand the TRSYS20 measuring system and how it works, the next step is to install it in the desired location. One measurement location is sufficient, but it is recommended to measure at two locations for redundancy.
Before applying the sensors, cleaning the wall's surface is important to prevent the sensors from falling off. The typical measurement time can range from one to two weeks with a minimum of three days, so it is important to attach the sensors robustly to the wall. Using the strain relief on the cables is advisable to prevent them from pulling the sensors off. Depending on the duration of the experiment, double-sided tape or silicone glue can be used to attach the HFP01 and thermocouples.
Moreover, the thermocouples and the heat flux sensors must be positioned close to each other and must be free from any air bubbles, as air bubbles can cause high thermal resistance, thereby affecting the heat flux measurement. Also, avoiding exposing the sensors to direct sunlight is preferable.
If you want more detailed installation insight, please read the article: Heat flux sensor installation: how to do it? Or watch the video below.
How to perform a measurement?
The measurement process can start after attaching the sensors to the wall and connecting the MCU to power. The Power On LED will indicate if it is done correctly. No software installation is required to connect the system to a computer, USB, or ethernet. The MCU provides a graphical user interface in the form of a webpage, which is a serial number followed by a URL. The serial number can be found on the certificate that comes with the box.
Upon opening the URL, a scatter plot of the measurement session will be displayed, showing the heat flux plotted against the temperature difference. Initially, there will be no data points, but a trend will emerge over time. The graph may contain blue outliers, indicating something wrong with the measurement. For example, one of the HPF01 sensors might have fallen off the wall. Ideally, the graph should show a straight line of increasing heat flux with increasing temperature difference, but in reality, a cloud of points is seen due to the wall's reaction time. If the temperature on one side changes, the heat flux on the other side may take several hours to react.
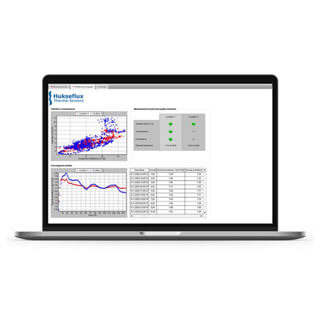
the heat flux is plotted against the temperature. On the
top right, the duration of the measurement is shown.
On the bottom, the convergence is monitored.
The measurement duration, which is at least three days, can be seen on the top right in Figure 8. The interface also checks for convergence inconsistency of the data. The calculated thermal resistance of both measurements is shown at the bottom of Figure 8. This part of the interface shows the calculated thermal resistance over time. The longer the measurement, the more accurate the thermal resistance gets. The average value of both locations is shown in the table on the bottom right. This result is generated every hour.
After a day, some data points with a reasonable thermal resistance value will appear. However, it is suggested that the thermal resistance be measured for at least a week for a more accurate calculation. Increasing the temperature difference also increases accuracy. This can be achieved by increasing the temperature inside the building or measuring during winter or summer.
Once the measurement is finished, the collected data can be downloaded from the data logger by connecting it to a computer. Then, the data can be analysed in accordance with ISO and ASTM standards. A report can be made using the Excel analysis template provided on the data logger's micro SD card.
Advantages over other measuring systems
There are several reasons why the TRSYS20 is a superior measuring system compared to others out there:
- It is robust and stable due to its heavy-duty components. The system's sensors can withstand repeated installation, typically required in this application where measuring systems are used at multiple locations over time. The sensors are also water- and corrosion-proof, making them highly durable.
- The TRSYS20 MCU can be connected to a local area network (LAN) via its ethernet port or directly to a PC or laptop via USB.
- Its user interface is intuitive and easy to use, as it is presented as a webpage accessible through a web browser. No software installation is required, and it provides an efficient way of controlling and reviewing experiments.
- The system allows simultaneous measurements in two locations. This feature provides redundancy, allowing users to verify that the measured values are representative of the wall or the option to measure two different walls in parallel, saving time.
- TRSYS20's high-resolution electronics and high-sensitivity heat flux sensors allow it to measure even minimal heat fluxes through the wall. Its sensor cable shielding ensures the system is insensitive to electrical disturbances commonly found in industrial environments.
Conclusion
If you need to measure the in-situ thermal resistance (R-value), thermal conductance (Λ-value), and thermal transmittance (U-value) of building envelope components, the TRSYS20 measuring system is the best option available. This system is equipped with advanced high-resolution electronics and a user-friendly graphical interface, making it easy to use. The TRSYS20 measuring system has several advantages over other systems, such as its ability to measure a wall's R-value in two locations simultaneously.
If you have any questions about measuring thermal resistance or heat flux, please don't hesitate to contact us at Hukseflux. We are always happy to assist you with any issues you may have.
Sources
Related to Heat transfer through a wall and insulation of a wall
Heat flux sensor installation: how to do it?
Insulation measurement with 2 thermocouples and a heat flux sensor